I will update this blog post when I find time along with data coming from the Outbreak. Code and data can be found in this Github repository. The data used are the one provided by Protezione Civile on the official repository.
SIR Model
The SIR model is a system of ODEs designed to model the dynamics of an epidemics not affected by birth and death. This model was originally developed by Kermack-McKendrick in 1927, and is expressed by the following ordinary differential equations:


In particular  is defined as the product between the average number of contacts per person times the probability the disease transmit at each contact, and
  is the duration of the infection in days. An other important quantity is the average number of secondary infection, i.e.
  , in particular in SIR model it is defined as
  . This is known to be a some sort of magic number when it comes to epidemic spread. If we define the two quantity:

we can rewrite (E1) as:


then the initial growth in infected is given by the ODE:

this tell us that if  is greater then one we will have an exponential growth in the infected. More detail regarding the significance of
  in particular related to the COVID-19 outbreak can be found in B1. The number for the COVID-19 has been estimated around 3.28, more information can be found in B2.
More sophisticated model have been introduced to model pandemics. Birth and death can be included in the SIR model, but given the fast dynamics of the COVID-19 outbreak this was not necessary. Model where the immunity is not achieved after the infection, called SIS model, have been developed, but given the limited period and the localization of the case study those model where not taken into consideration. Last but not least model that take in consideration age structure can be used, and given the way COVID-19 affect differently elderly population, this would have been appropriate. But due to the complexity in building the contact matrix was decided not to use those type of models. More complex deterministic model have been applied to the Chinese COVID-19 outbreak in B3 and B4. All the model here discussed are deterministic model, stochastic model are an other valid approach. In particular we can see a branching model applied to the COVID-19 outbreak in B5. More information about the epidemic modeling can be found in B6.
Data
Our aim was to fit the SIR model to the COVID-19 outbreak in Lombardy, to find the right configuration of two parameters i.e.  , . We estimated those parameters confronting model simulation with data collected from the first 12 days of the outbreak, starting from the 21st of February to the 3rd of March. We limit the data taken in consideration to the first 12 days because due to change of the testing policy in Lombardy the number of new infection could not be considered completely reliable. In particular we decided to discharge the data from the day the mortality rate surpassed the world average, which is 3.4% according to B7, by more then the variance in the death rate, i.e. 0.52.
Fitting
As previously mentioned is important to chose the most accurate and parameters for the model to correctly represent the COVID-19 outbreak. We then estimated the value of and minimize the following error:

where  and
and  are the recorded data from the Lombardy outbreak, as described in section regarding the data, and
  is equal to 12.
To minimize  we used a gradient descent method with starting point
  ranging in
 ![[0.1,2.0]](https://www.uzerbinati.eu/wp-content/ql-cache/quicklatex.com-3018e70bb34132cc232d163ed3624645_l3.png "Rendered by QuickLaTeX.com") and
and  ranging in
 ![[\frac{1}{23},1]](https://www.uzerbinati.eu/wp-content/ql-cache/quicklatex.com-33eb64cd087f4d3520523ee97b477433_l3.png "Rendered by QuickLaTeX.com") . In particular automatic differentiation based on centered finite difference approximation is used to compute the gradient. The parameters for which the model best fitted the data, according to the error function , were found to be
. In particular automatic differentiation based on centered finite difference approximation is used to compute the gradient. The parameters for which the model best fitted the data, according to the error function , were found to be  and
and  .
.
This give us an initial number equal to  , which placed the number for the Lombardy outbreak just below the worst estimate for the Hubei province outbreak, B2.
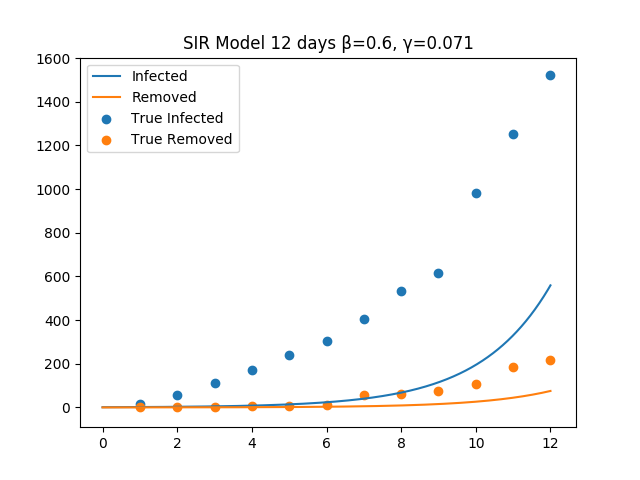
The figure show the SIR model with a non optimal choice for beta and gamma. 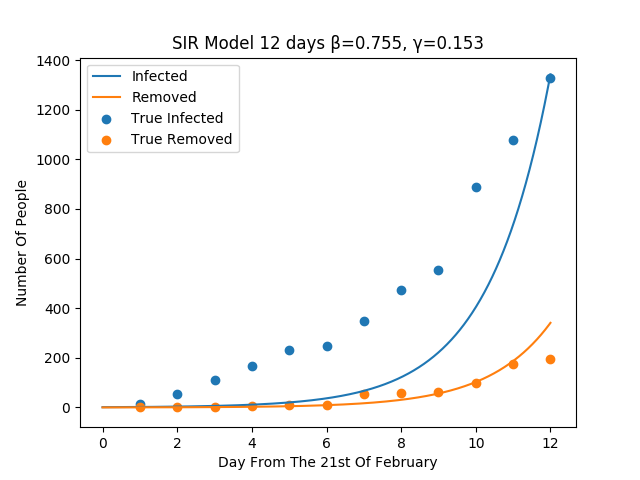
The figure show the SIR model with the optimal choice for beta and gamma.
Quarantine
In this section we described how to take into account the effect of quarantine in our SIR model. We decided to model the effect of quarantine studying the COVID-19 data from the Lodi province where most of the original red zone where placed. We computed the R0 number form the data using the following definition:

in particular we tracked the evolution of the for COVID-19 in the Lodi province, assuming a fixed value for the  . Last but not least we used the mean of the
  value over four days, to damp the statistical error. We decided to model the effect of quarantine modifying (E1) as follow:


where  represent the fraction of that is effected by the quarantine, we can image this as a measure of how much the red zone quarantine procedure is respected in Lombardy. To compute
  and
and  we represented the clustered data from Lodi in a logarithmic scale and then we used linear regression.
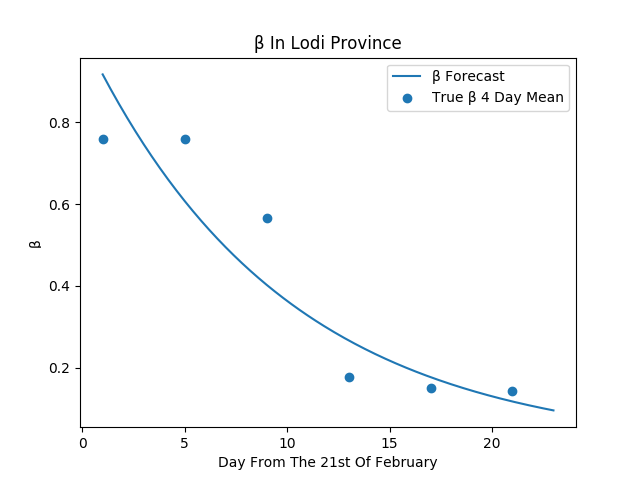
This figure represent an estimation of the beta value, fitted on the clustered data from the Lodi province using a linear regression in the logarithmic space.
Results
Once we run the simulation for the SIR modeling over a full period of 120 days we find out that the peak in infection will be reached between the 27th and the 31st day of the infection. Furthermore the critical proportion of the people to be vaccinated, to gain hard immunity, in case a vaccine is developed, need to be around the 80% of the population.
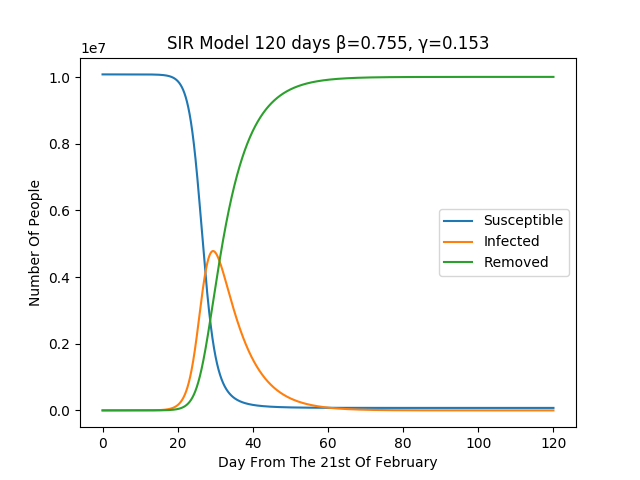
The figure show the simulation for the above described SIR
model over the duration of 120 days.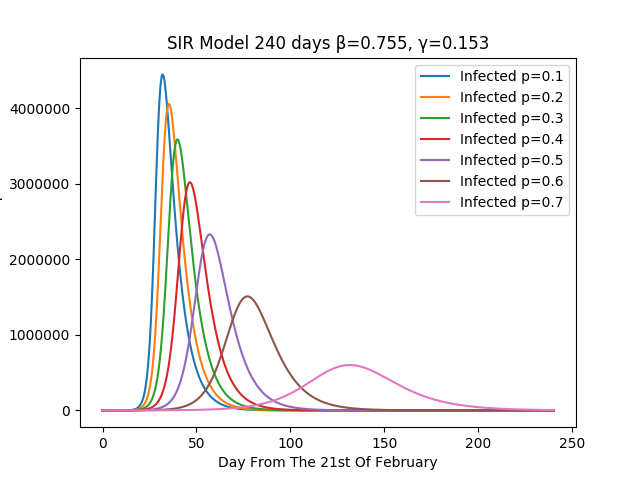
This figure shows the effect of quarantine with changing value of p.
Reference
B1) Giulio Viceconte and Nicola Petrosillo. Covid-19 r0: Magic number or conundrum? Infectious Disease Reports, 12(1), 2020.
B2) Ying Liu, Albert A Gayle, Annelies Wilder-Smith, and Joacim Rocklöv. The reproductive number of covid-19 is higher compared to sars coronavirus. Journal of Travel Medicine, 2020.
B3) Jonathan M Read, Jessica RE Bridgen, Derek AT Cummings, Antonia Ho, and Chris P Jewell. Novel coronavirus 2019-ncov: early estimation of epidemiological parameters and epidemic predictions. medRxiv, 2020.
B4) Biao Tang, Xia Wang, Qian Li, Nicola Luigi Bragazzi, Sanyi Tang, Yanni Xiao, and Jianhong Wu. Estimation of the transmission risk of the 2019-ncov and its implication for public health interventions. Journal of Clinical Medicine, 9(2):462, 2020.
B5) Joel Hellewell, Sam Abbott, Amy Gimma, Nikos I Bosse, Christopher I Jarvis, Timothy W Russell, James D Munday, Adam J Kucharski, W John Edmunds, Fiona Sun, et al. Feasibility of controlling covid-19 outbreaks by isolation of cases and contacts. The Lancet Global Health, 2020.
B6) Matt J Keeling and Pejman Rohani. Modeling infectious diseases in humans and animals. Princeton University Press, 2011.
B7) T. Adhanom. WHO director-general’s opening remarks at the media briefing on covid-19 – 3 march 2020”, 2020.
B8) Jantien A Backer, Don Klinkenberg, and Jacco Wallinga. Incubation period of 2019 novel coronavirus (2019-ncov) infections among travellers from wuhan, china, 20–28 january 2020. Eurosurveillance, 25(5), 2020.
B9) Qun Li, Xuhua Guan, Peng Wu, Xiaoye Wang, Lei Zhou, Yeqing Tong, Ruiqi Ren, Kathy SM Leung, Eric HY Lau, Jessica Y Wong, et al. Early transmission dynamics in wuhan, china, of novel coronavirus–infected pneumonia. New England Journal of Medicine, 2020.
B10) Brauer, Fred, Carlos Castillo-Chavez, and Carlos Castillo-Chavez. Mathematical models in population biology and epidemiology. Vol. 2. New York: Springer, 2012.